Showing posts with label Commodities. Show all posts

Saturday, March 25, 2017

Commodities: Time to shine?


The commodity sector remains one of the most important sectors for Malaysia’s economy.

As prices of several commodities such as crude oil and crude palm oil (CPO) were on the uptrend in the past 12 months, the scenario has put fresh hopes that the country’s economy will be on better footing this year.

Malaysia, being a heavy exporting country, has been relying on the exports of commodities such as oil palm and crude oil to boost the country’s economic growth.

Thus, in an effort to boost demand and ensure the quality of production, the government is providing a grant of RM50 million to assist the commodity industry in addressing food safety concerns, including reducing the level of containment in palm oil.

Minister of Plantation Industries and Commodities Datuk Seri Mah Siew Keong disclosed that the grant is open to all factories and refineries working together to do research and further increase the quality of palm oil.

Additionally, to further promote the image of the oil palm industry, Mah said Malaysia would embark on the mandatory certification of certified and sustainable palm oil under the framework of Malaysian Sustainable Palm Oil.

The scheme – which was implemented on a voluntary basis beginning 2015 – will be made mandatory in stages starting from December 31, 2018.

On the outlook for palm oil, Mah expects exports to reach RM70 billion this year from RM67 billion in 2016 and CPO price to average between RM2,700 and RM2,800 per tonne this year.

“We are maintaining our earlier forecast that the CPO will average between RM2,700 per tonne and RM2,800 per tonne in 2017.

“This is on anticipation of higher prices, driven by various government efforts and initiatives, including venturing into various other markets, especially India and Iran,” Mah reportedly said.


Oil Palm

According to industry experts, the production of global CPO is poised to increase 11 per cent to 65 million tonnes in 2017 from 58.3 million tonnes last year as normal weather conditions in major growing areas would help raise crop yield.

Likewise, industry observers believed the absence of El Nino weather this year will enable production of CPO to resume back to normal and is projected to increase gradually towards year end.

Analysts and industry observers opined that CPO production is expected to recover in the second half of the year as demand begins to normalise.

During a recent conference on the outlook of the palm oil industry, Dr. James Fry, a renowned industry player in the palm oil industry believed that CPO output is poised to increase significantly in 2017.

He added the higher CPO output will increase the inventory level of Malaysia’s palm oil to above two million metric tonnes (MT) by July 2017 and subsequently to an estimated 2.5 million MT in the fourth quarter of 2017 (4Q17).

Fry noted the recovery of CPO production will result in CPO price averaging RM2,500 per tonne during 3Q17 before moderating to RM2,250 per tonne in 4Q17.

Concurring with Fry on the moderating CPO price were analysts at research houses who opined that CPO price could soften to RM2,250-RM2,400 per MT as CPO production started to gain momentum towards year-end.

In spite of that, they believed the greater use of biodiesel and the potential return of El Nino could spark CPO price to strengthen further in 2018 as the lag effect on production would kick-in by April next year.

Deputy Minister of Plantation Industries and Commodities Datuk Datu Nasrun Datu Mansur said,“The government intends to implement the B10 blend to encourage the use of environmentally friendly fuels produced from palm oil this year.

The implementation of the biodiesel blends will contribute to the environment with cleaner emissions and well as economic prosperity and stability of palm oil prices in the market,” he said.

Having said that, the palm oil industry has played a significant role for the country’s socio-economic development especially for the low-income population through smallholder programme.

As such, it is important to ensure that the industry will be developed in a environmental friendly and sustainable approach through the certified sustainable palm oil (CSPO) and the Roundtable on Sustainable Palm Oil (RSPO) certification.


Crude oil

Despite a correction in crude oil price recently, analysts believed the price will eventually move higher and end the year above US$50 per barrel.

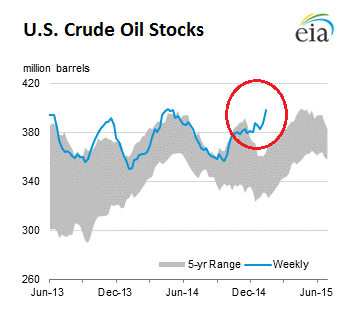
Oil prices have weakened over the past week due to concern on building oil stocks and revival of rigs count in US coupled with moderation of oil demand growth.

Kenanga Research opined that the development was not surprising as US shale producers were the biggest beneficiaries of lower oil prices.

Nonetheless, the research firm still expects consistent compliance from the Organisation of Petroleum Exporting Countries (OPEC) nation to adhere to the oil production cut and higher compliance from Russia from current level until the end of June although the positives from the production cut between OPEC and non-OPEC nations have been taken into consideration in its oil price projection.

Additionally, the research firm opined that the oil market is building in expectations for an extension after the six-month period which will be decided in the next OPEC meeting in May.

Overall, Kenanga Research retained its Brent oil price forecast of US$55 per barrel in 2017.

OCBC Bank Research believed crude oil will push towards a rebalanced environment if a unified OPEC unanimously acts to effectively reduce oil production.

The traditional acts of overproducing (despite having quotas), internal disagreements, and even exclusions from cuts by selected countries may delay the rebalancing yet again.

OCBC commodities analyst Barnabas Gan said, “We think OPEC has endured low oil prices for far too long, with much damage already done on both fiscal and social fronts.

“That alone should persuade the cartel to stay true to its production cut. Global growth should accelerate into 2017 and support crude oil demand.

“Collectively, these should give crude oil prices a welcomed boost in 2017,” he believed.

Gan stressed that the central argument for oil price to trend higher in 2017 was largely underpinned by the rebalancing story.

He added, “We opine that the path of least resistance would be for the oil markets to fully balance itself by the second half of 2017 (2H17) as oil demand recover while supply growth decelerates.

“We strongly believe that the oil markets will one day rebalance itself, be it by the invisible hand or by the workings of the OPEC. The question is when.

“Should either side of the equation falter, either from OPEC’s inability to unanimously limit production or from the sudden shortfall in demand, the oil climate in 2017 may behave just like how it did in 2016,” he opined.

He envisaged that oil price will have a a gradual rally towards the $65 per barrel by the end of this year.


Aluminium

Price of aluminium has been on the rise since early last year due to positive sentiment attributed to several factors.

Those factors were the anticipated fiscal stimulus from the new administration of the US and the expectation that the Chinese government will continue its fiscal support for economic growth.


As a result, aluminium manufacturers have been able to generate higher turnover from the sales of their products and benefitted from the foreign exchange gains on their US dollar sales.

For instance, one company which is riding on the increased price of aluminium is Press Metal Bhd (Press Metal).

The company’s financial results for financial year 2016 (FY16) have been boosted by higher smelting output and improved London Metal Exchange (LME) price.

Following a company’s meeting, the research arm of Kenanga Investment Bank Bhd (Kenanga Research) in a report said it was positive on the company’s earnings for this year underpinned by the bullish outlook on aluminium price.

Besides that, the research firm noted a recent ruling by China to cut production for both aluminium and alumina has further provide support for aluminium price over the short-term.

Press Metal in its latest accounts notes said the Chinese government has been very concerned lately of the country’s environment pollution.

As a measure to reduce pollution, the company observed that the Chinese government was looking at measures to limit industries emission and the high energy consuming industries which includes the aluminium industry.

In that event, Press Metal noted the move will affect the production of aluminium for several months and thus reduce the annual output.

Therefore, the company believed the move will enable aluminium price to trade higher due to healthy demand and supply and opined that the aluminium industry is in a more balanced situation currently as compared to the past few years.

Apart from that, Kenanga Research observed that countries like India and Australia are exploring or have implemented anti-dumping duties for the import of Chinese aluminum, which in turn provide a level playing field for aluminium manufacturers to operate their businesses.

Furthermore, the research firm noted with limited production of aluminium in the US due to high manufacturing costs, the premiums on aluminium price were on the rise as forward price has reached a premium of approximately US$200 per metric tonne (MT) from a low of US$160 per MT in October 2015.

Going forward, Kenanga Research expects Press Metal to manage its cost more effectively, especially the cost for logistics, as the adjoining Samalaju Port in Bintulu is scheduled to start operations by the middle of 2017.

Meanwhile, the research firm gathered that the company is currently constructing a conveyor belt directly into the port.

Apart from that, the research firm also gathered the company’s aluminium plant in Mukah is expected to enjoy reductions in cost and transportation time as the construction of a road will save approximately 100km in travelling distance to the closest port.

Thus, Kenanga Research was positive on those developments as the measures which is going to be implemented should reduce logistics cost by US$8-US$10 per MT.

Going forward, the research firm expects Press Metal to further expand the company’s smelting capacity once more electricity supply is secured.

It gathered that the company has sufficient area to commission a third Samalaju plant with a production capacity of 320,000 MT per year.

Moreover, Kenanga Research also expects the company to register profit margin expansion as Press Metal is doubling its existing billet production capacity by the middle of 2017.

Over the longer term, the research firm said the company is targeting 50 per cent alloy production by 2018.

It forecasts that the alloy production will generate additional revenue of US$150 per MT on top of standard aluminum prices to Press Metal in the future.

Kenanga Research believed Press Metal’s long-term earnings potential will be further supported by improving production efficiency and potential for expansion of the company’s business in the upstream, midstream and downstream segments.


Gold

Moving on to another commodity is gold. In Malaysia, gold production is extracted from 14 mines mostly in Pahang, Kelantan and Terengganu.

As of 2015, Pahang has contributed about 74 per cent of the country’s gold output.

Malaysian Chamber of Mines’ executive director Muhamad Nor Muhamad revealed that the gold industry’s growth for the country was driven by higher output and rising gold price.

He observed the upstream sector of the gold industry has grown three-fold in the past decade to RM780 million in 2015 from RM211 million in 2006.

“The contribution from the upstream sector was fairly significant, producing 4.73 tonnes of gold worth RM780.8 million and exporting 4.06 tonnes of smelted gold worth RM523.4 million in 2015,” he reportedly said.

He also said gold was primarily exported to Australia, Singapore, Switzerland, Hong Kong, the United Arab Emirates (UAE) and Thailand.

He added the exports are in the form of “dore bars” – semi-pure alloy containing 85 per cent gold and the balance either copper, silver, lead, zinc or selenium.

“They are then exported for refining into 99.9 per cent gold bars.

“However, the smaller producers usually sell their gold ores to local goldsmiths who then smelt and refine them at their own premises for making into jewellery,” he said.

Muhamad Nor noted Malaysia did not have a gold refinery as most of the precious metal, after being smelted, would be exported to be refined in other countries especially by major miners.

“The major producers in the country are often associated with big international gold players who have their own refinery in other country,” he said.

On the gold industry’s outlook, Muhamad Nor believed the exploration activities undertaken by the Department of Minerals and Geoscience Malaysia had identified several areas with anomalous gold in Sarawak, Sabah, Pahang, Johor and Kelantan.

“This means that our gold industry has the potential to sustain mine production at its historical level for several years to come,” he added.

According to local data, since 1972, gold output reached its highest of 4.739 tonnes in 2003 before declining to 2.794 tonnes in 2009 and bounced back to 4.732 tonnes in 2015.

However, the major factor that will make the mines feasible is the gold price which in 2015, had averaged at US$1,160.11 per ounce (oz), he believed.

Currently, gold price fluctuated between US$1,200 and US$1,260 in the past one month.

Moving on, Muhamad Nor opined that the more significant contribution came from the downstream sector whose economic value had far exceeded the upstream while the upstream sector continued to grow.

“Of significance is the contribution by the downstream sector which imported gold for making into jewellery and accessories not only for the domestic but also the international market.

“This was reflected in the value of gold imported to produce jewellery whereby in 2015 alone, the country imported 77.53 tonnes of gold valued at RM11.07 billion mainly from Switzerland, UAE, Singapore, Turkey, Hong Kong, US and Thailand, he said.

Meanwhile, Federation of Goldsmiths and Jewellers Association of Malaysia president Ermin Siow said Malaysia was a significant gold jewellery exporter, of around 50 tonnes annually worth between RM6 billion and RM8 billion mainly to the Middle East countries.

He said the volume far exceeded domestic usage of 20-25 tonnes annually.

“For plain gold jewellery exports, I would reckon we now rank among the top five in the world,” he said.

To note, one local company which is mining gold is Borneo Oil Bhd (Borneo Oil).

Borneo Oil through its wholly-owned subsidiary Borneo Oil and Gas Corporation Sdn Bhd (Borneo O&G) is involved in the mining of gold at a site in Pahang.

The company in a filing to Bursa Malaysia recently said it has identified additional gold mineralisation at a site at Bukit Ibam, Pahang.

Borneo O&G said it has discovered average gold grade of 2.68g per tons, including high grade zone of one meter with 19.2g per tonne gold and 14 meters averaging 1.39g per tonne gold.

The company revealed that it is finalising its heap leaching process at its mining location at Bukit Ibam and is looking forward to process the 1.80 tonne of its inferred gold resources in the near future.

With the sales of the gold resources, Borneo O&G hoped that the turnover is expected to contribute substantially to Borneo Oil Group’s revenue.

Borneo Oil opined that the price of gold is currently in the early stages of entering a long term bullish trend.

In contrast, OCBC Bank Research believed gold prices are likely to trend in a bearish fashion given the hope for a rosier global economy and higher US interest rates this year.

However, the research firm opined that the various exogenous uncertainties this year may give rise to safe haven demand.

OCBC’s Gan said, “Through the test of time, gold prices have correlated firmly with the value of the greenback, which consequently has been a function of interest rates in the US.

“Fundamentally, gold is a quasi foreign-exchange-commodity asset and the sustained likelihood for the Federal Reserve to engage in further rate hikes this year should translate into a firmer US dollar then.

“In a nutshell, barring a quick and sudden deterioration in risk appetite given the many event risks discussed earlier, our call for gold to trend to $1,100 per oz in 2017 is largely underpinned by this driver (of higher interest rates) alone,” he said.


Rubber

Aside from that, rubber is another commodity which has gained worldwide usage due to the exports of rubber gloves and other rubber products.

In spite of that, rubber price has remained subdued and the government is looking at various initiatives to boost the demand for rubber and subsequently raise its price.

Mah said the government has been doing research on rubberised roads over the last three years to ensure that there is market for local rubber and most importantly smallholders who are tapping the rubber will benefit from their produce.

“We must build the rubberised roads in small towns and certain parts of (major) highways.

“The main purpose is to ensure that our 440,000 rubber smallholders have sustainable demand.

“We need to support our smallholders, who might otherwise shift away from natural rubber due to weak prices.

“There are about 1.2 million smallholders in the country (550,000 smallholders in the palm oil industry, 440,000 in the rubber industry and 60,000 in the pepper industry),” he observed.

Mah outlined that the maintenance costs for rubberised roads in the long run will be cheaper although the initial cost of building rubberised roads was 16 per cent higher than normal bitumen-based asphalt.

He noted rubberised roads were more durable and can bear heavier loads.

Concurring with Mah, Malaysian Rubber Board (MRB) director-general Datuk Dr Mohd Akbar Md Said believed Malaysia is ready to rubberise about 1,000 kilometres of state roads starting this year,

He explained that the diverse use of rubber, especially for construction, would help reduce the current rubber stockpile and shore up flagging prices for the commodity.

He opined that rubberised roads offer superior performance, safety, durability and low maintenance as compared with conventional roads.

Mohd Akbar shared that the board was looking at how to increase the domestic consumption of the commodity in other sectors.

He said it was possible to rubberise roads in the country as evident from the one kilometre rubberised road built at the Kota Tinggi Research Station in Johor.

Mohd Akbar revealed that Thailand, Indonesia and Malaysia have decided to increase the domestic consumption of rubber and one of the options was to use natural rubber for road construction.

He noted the three countries have looked into the possibility of using 300,000 tonnes of natural rubber for the next five to 10 years.

Meanwhile, rubberised roads is expected to be constructed using rubber cup lumps or naturally-coagulated latex, which will be processed into bituminous cup lumps and then mixed into asphalt.

The use of cup lumps – which are obtained directly from rubber trees without going through any manufacturing process – is expected to boost domestic demand for the material by 10 per cent annually.

It was reported that several rubberised asphalt pilot projects were in place and their performance was being analysed.

The field study involved five projects, one each in Negeri Sembilan, Kedah, Pahang, Kelantan and Selangor.

Source: Borneo Post

Thursday, October 22, 2015

The Problem With Oil Prices Is That They Are Not Low Enough


The problem with oil prices is that they are not low enough.

Current oil prices are simply not low enough to stop over-production. Unless external investment capital is curtailed and producers learn to live within cash flow, a production surplus and low oil prices will persist for years.

Energy Is The Economy

GDP (gross domestic product) correlates empirically with oil prices (Figure 1). GDP increases when oil prices are low or falling; GDP is flat when oil prices are high or rising (GDP and oil price in the figure are in August 2015 dollars).


Figure 1. U.S. GDP and WTI oil price. GDP and WTI are in August 2015 dollars. Note: I use WTI prices because Brent pricing did not exist before the 1970s.
Source: U.S. Bureau of Labor Statistics, The World Bank, EIA and Labyrinth Consulting Services, Inc.


This is because global economic output is highly sensitive to the cost and availability of energy resources (it is also sensitive to debt). Liquid fuels-gasoline, diesel and jet fuel-power most worldwide transport of materials, and electricity from coal and natural gas powers most manufacturing. When energy prices are high, profit margins are lower and economic output and growth slows, and vice versa.

Because oil prices were high in the 4 years before September 2014 and the subsequent oil-price collapse, GDP was flat and economic growth was slow. That, along with high government, corporate and household debt loads, is the main reason why the post-2008 recession has been so persistent and difficult to correct through monetary policy.

Why Oil Prices Were High 2010-2014 and Why They Are Low Today

Brent oil prices exceeded $90 per barrel (August 2015 dollars) for 46 months from November 2010 until September 2014 (Figure 2). This was the longest period of high oil prices in history. Prolonged high prices made tight oil, ultra-deep water oil and oil-sand development feasible. Over-investment and subsequent over-production of expensive oil contributed to the global liquids surplus that caused oil prices to collapse beginning in September 2014.

Figure 2. Brent price in 2015 dollars and world liquids production deficit or surplus.
Source: EIA, U.S., U.S. Bureau of Labor Statistics and Labyrinth Consulting Services, Inc.


Oil prices were high during during the 4 years before prices collapsed because world liquids production deficits dominated the oil markets. This was due mostly to ongoing politically-driven supply interruptions in Libya, Iran, and Sudan beginning in 2011. The easing of tensions particularly in Libya after 2013 along with increasing volumes of tight and other expensive oil led to a production surplus by early 2014 (Figure 3). Before January 2014, supply was less than consumption but afterward, supply was greater than consumption.


Figure 3. World liquids supply and consumption, and Brent crude oil price.
Source: EIA and Labyrinth Consulting Services, Inc.


The global production surplus has persisted for 21 months and supply is still 1.2 million barrels per day more than consumption. This is the main cause of low oil prices that began in mid-2014.

Why Over-Production Continues

Actions taken by the U.S. Federal Reserve Bank to stimulate the economy after the Financial Crisis in 2008 were partly responsible for high oil prices and for the over-production of tight oil in the U.S. that eventually caused oil prices to collapse in 2014.

The U.S. central bank lowered the Federal Funds Rate-the interest that it charges for loans to commercial banks-from approximately 5.5% before the 2008 collapse to 0.2% in late 2008 (Figure 4). By mid-2014, the rate had dropped below 0.1%.


Figure 4. U.S. Federal Funds interest rates, M1 money supply and CPI-adjusted WTI crude oil prices.
Source: EIA, U.S. Bureau of Labor Statistics, U.S. Federal Reserve System and Labyrinth Consulting Services, Inc.


At the same time, the Federal Reserve Bank increased the U.S. money supply (Figure 4) from about $1.4 trillion before the 2008 collapse to more than $3 trillion today as part of a policy called Quantitative Easing (QE). QE involved creating money to buy U.S. Treasury bonds. This lowered the yield that these bonds paid and forced investors into riskier investments like the stock market and U.S. exploration and production (E&P) company bonds and secondary share offerings.

There is a negative correlation between the value of the U.S. dollar relative to other currencies and oil prices (Figure 5). When the U.S. dollar is strong, oil prices generally fall and vice versa chiefly because worldwide oil commodity trades are denominated in dollars.


Figure 5. U.S. trade-weighted dollar value and CPI-adjusted Brent crude oil prices.
Source: EIA, U.S. Bureau of Labor Statistics, U.S. Federal Reserve System and Labyrinth Consulting Services, Inc.


Quantitative Easing, the increase in the U.S. money supply and artificially low interest rates resulted in a weaker U.S. dollar that was a contributing factor to higher oil prices after 2008 (an OPEC production cut in early 2009 was another important factor). The end of QE in mid-2014 and a resulting stronger U.S. dollar corresponded with the collapse in world oil prices (Figure 5).

The relationship between interest rates, money supply, the strength of the dollar and oil prices is complicated and I do not mean to over-simplify its complexity. The observed patterns are, nevertheless, interesting and useful for understanding the broad trends of the last several years at least on a high level.

The net effect of all of these monetary policies was to undermine conventional, passive investments-savings accounts, CDs, U.S. Treasury bonds, etc.-because of low yields (1- 2.5%). Investors were driven to the U.S. E&P sector where high-yield ('junk') bonds and secondary share offerings provide yields of 6-10%. These investments are based on a coupon payment or dividend and not on the company's success unless, of course, the company goes bankrupt.

This and other risks are rationalized by the fact that the investments are in the fiscally 'safe' United States, are backed by a hard asset-oil and gas-in the ground, and that even if a company becomes distressed, it will likely be bought and the investment preserved.

More than $61 billion has flowed to North American E&P companies so far in 2015 both as equity and debt (Figure 6). This is more than in any previous year despite low oil prices, plunging stock prices and poor financial performance for most E&P companies.


Figure 6. Private equity capital directed to North American energy companies.
Source: Wall Street Journal (September 3, 2015) and Bloomberg Businessweek (October 15, 2015).


The only expectation from the financial markets is apparently that production and reserves grow or are at least maintained.

A weak global economy, the monetary policies that were used to strengthen it, and world geopolitical events combined to produce a surge in expensive oil production that was made possible by high oil prices and almost infinite access to capital by producers.

Now that oil prices have fallen by half, many expected that production would fall sharply.

That has not happened because capital supply has not fallen with lower prices but has increased. To be sure, U.S. production has declined and will decrease further. EIA's forecast (Figure 7) suggests that it will fall approximately 940,000 bopd from its peak in April 2015.


Figure 7. EIA crude oil production and forecast.
Source: EIA and Labyrinth Consulting Services, Inc.


The U.S., however, is not the world and less than a million barrels per day of lower U.S. oil production will not make much of a difference in the global surplus. Although world production has declined somewhat, it is still 850,000 bpd higher than its 2014 peak and a supply surplus persists (Figure 8).


Figure 8. World liquids production, consumption and production surplus or deficit.
Source: EIA and Labyrinth Consulting Services, Inc.


Global producers are similar to their U.S. counterparts. Most of them must also satisfy investor expectations, have considerable access to capital, must maintain cash flow, even at a loss, to service debt, and have benefited from greatly reduced oil field service costs that accompany lower oil prices.

The Problem With Oil Prices Is That They Are Not Low Enough

Brent international oil prices have averaged more than $55 per barrel ($51 for WTI) in 2015. As long as prices remain in that range, I doubt that production will fall enough to balance the market for several years or more barring a surge in demand or renewed supply interruptions.

Figure 9 shows that the long-term average oil price (1950-2015) is $45 per barrel in August 2015 dollars.


Figure 9. WTI oil prices in August 2015 dollars, January 1950 - August 2015.
Source: EIA, U.S. Bureau of Labor Statistics and Labyrinth Consulting Services, Inc.


Before the Arab Oil Embargo (1973-74) and the beginning of the Iran-Iraq War (1980), the average price was $23 per barrel. In the 1986 to 2003 period after these oil shocks and before the Financial Collapse, prices averaged $34 per barrel.

These prices seem quite low from our sticker-shocked perspective of the early 21st century, yet oil companies made profits when prices were $15 to $25 real dollars per barrel less than they are today. More importantly, those periods of low oil prices were also times of economic growth and prosperity (Figure 1), whereas the intervening periods of higher oil prices were times of low economic growth.

Capital will continue to flow to E&P companies as long as high yields on bonds and secondary share offerings are paid. Sustained oil prices in the $30-40 range would create sufficient distress among high-cost zombie producers to cause defaults on those offerings. This alone will stop the capital enablers-the investment banks-from directing funds to the E&P sector.

Many believe that the upcoming credit re-determinations and year-end reserve write-downs will greatly limit available capital, and that this will lead to oil market balance. I hope that they are right. I suspect, however, that the capital enablers will stay the course despite higher risks simply because they are unable to identify alternative investments that offer a comparable yield.

Some like OPEC and Wood Mackenzie believe that demand growth will balance the oil market. I also hope that they are right. Others, however, like the IEA take a more pessimistic view because of a weak global economy. The IEA's view of the economy seems sound to me and I am, therefore, doubtful that demand growth will balance the market.

Still others are hopeful that OPEC will cut production and that will balance the market. I don't believe that will happen. A production cut would accomplish little except perhaps for a short-term increase in prices that would result in higher cash flows and a rebound in drilling activity-in short, it would compound the problem of over-supply.

The only way to achieve oil market balance is for prices to go low enough for long enough to stop the flow of external capital to the producers and to force them to live within cash flow. The intriguing aspect of this proposition is the possibility of a return to economic growth that has so far eluded the best efforts of central bankers and economists.


Source: http://www.oilvoice.com/n/The-Problem-With-Oil-Prices-Is-That-They-Are-Not-Low-Enough/a42a7c59c41d.aspx

Wednesday, July 29, 2015

Commodities Collapsed Just Before The Last Stock Market Crash – So Guess What Is Happening Right Now?


If we were going to see a stock market crash in the United States in the fall of 2015 (to use a hypothetical example), we would expect to see commodity prices begin to crash a few months ahead of time.  This is precisely what happened just before the great financial crisis of 2008, and we are watching the exact same thing happen again right now.  On Wednesday, commodities got absolutely pummeled, and at this point the Bloomberg Commodity Index is down a whopping 26 percent over the past twelve months.  When global economic activity slows down, demand for raw materials sinks and prices drop.  So important global commodities such as copper, iron ore, aluminum, zinc, nickel, lead, tin and lumber are all considered to be key “leading indicators” that can tell us a lot about where things are heading next.  And what they are telling us right now is that we are rapidly approaching a global economic meltdown.
If the global economy was actually healthy and expanding, the demand for commodities would be increasing and that would tend to drive prices up.  But instead, prices continue to go down.
The Bloomberg Commodity Index just hit a brand new 13-year low.  That means that global commodity prices are already lower than they were during the worst moments of the last financial crisis
The commodities rout that’s pushed prices to a 13-year low pulled some of the biggest mining and energy companies below levels seen during the financial crisis.
The FTSE 350 Mining Index plunged as much as 4.9 percent to the lowest since 2009 on Wednesday, with BHP Billiton Ltd. and Anglo American Plc leading declines. Gold and copper are near the lowest in at least five years, while crude oil retreated to $50 a barrel.
This commodity bear market is like a train wreck in slow motion,” said Andy Pfaff, the chief investment officer for commodities at MitonOptimal in Cape Town. “It has a lot of momentum and doesn’t come to a sudden stop.”
Commodity prices have not been this low since April 2002.  According to Bloomberg, some of the commodities being hit the hardest include soybean oil, copper, zinc and gasoline.  And this commodity crash is already having a dramatic impact on some of the biggest commodity-producing nations on the globe.  Just consider what Gerald Celente recently told Eric King
We now see that the Australian dollar is at a six-year low against the U.S. dollar. What are Australia’s biggest exports? How about iron-ore and other metals.
If we look at Canada, their currency is also now at a six-year low vs the U.S. dollar. Well, Canada is a big oil exporter, particularly some tar sands oil, which is expensive to produce.
We also now have the Brazilian real at a 10-year low vs the U.S. dollar. Why? Because it’s a natural resource rich country and they don’t have a strong market to sell their natural resources to.
Meanwhile, the Indian rupee is at a 17-year low vs the U.S. dollar. This is because manufacturing is slowing down and there is less development. If the Americans aren’t buying, the Indians, the Chinese, the Vietnamese — they’re not making things.
All of this is so, so similar to what we experienced in the run up to the financial crisis of 2008.  Just a couple of days ago, I talked about how the U.S. dollar got really strong just prior to the last stock market crash.  The same patterns keep playing out over and over, and yet most in the mainstream media refuse to see what is happening.
Something else that happened just a few months before the last stock market crash was a collapse of the junk bond market.
Guess what?
That is starting to happen again too.  Just check out this chart.
I know that I must sound like a broken record.  But I think that it is extremely important to document these things.  When the next financial collapse takes place, virtually everyone in the mainstream media will be talking about what a “surprise” it is.
But for those that have been paying attention, it won’t be much of a “surprise” at all.
When the stock market does crash, how far might it fall?
During a recent appearance on CNBC, Marc Faber suggested that it could decline by up to 40 percent
The U.S. stock market could “easily” drop 20 percent to 40 percent, closely followed contrarian Marc Faber said Wednesday—citing a host of factors including the growing list of companies trading below their 200-day moving average.
In recent days, “there were [also] more declining than advancing stocks, and the list of 12-month new lows was very high on Friday,” the publisher of The Gloom, Boom & Doom Report told CNBC’s “Squawk Box.”
“It shows you a lot of stocks are already declining.”
Others, including myself, believe that what we are going to experience is going to be even worse than that.
We live in such a fast-paced world, and most of us don’t have the patience to wait for long-term trends to play out.
If the stock market is not crashing today, to most people that means that everything must be fine.
But once it has crashed, everyone is going to be complaining that they weren’t warned in advance about what was coming and everyone will be complaining that nobody ever fixed the things that caused the exact same problems the last time around.
Personally, I am trying very hard to make sure that nobody can accuse me of not sounding the alarm about the storm that is on the horizon.
The world has never been in more debt, our “too big to fail” banks have never been more reckless, and global financial markets have never been more primed for a collapse.
Amazingly, there are still a lot of “experts” out there that insist that everything is going to be okay somehow.
Of course many of those exact same “experts” were telling us the same thing just before the stock market crashed in 2008 too.
A great financial shaking has already begun around the world, and it will hit U.S. financial markets very soon.
I hope that you are getting ready while you still can.

Tuesday, February 3, 2015

This Chart shows Why the Oil Bust will Last


by  • 


Soaring US crude oil inventories.


Crude oil inventories in the US (excluding the Strategic Petroleum Reserve) rose by 10.1 million barrels to 397.9 million barrels during the week ended January 16, the EIA reported on Thursday. Inventories have now reached 397.9 million barrels, the highest level for this time of year in “at least the last 80 years,” or as far as the EIA’s records go back.
This chart by the EIA shows that current inventory levels (blue line) have been on a terrific upward trajectory that defies the 5-year range and seasonal movements.
US-crude-oil-stocks_2015-01-22
These ballooning crude oil stocks will exert further downward pressure on prices.

What I’m scratching my head about is what these speculators are thinking when they’re leasing tankers to fill them up with “cheap” crude, waiting for the price to rise. Leasing a tanker is not free, unlike borrowing money overnight. And there are plenty of other costs and risks involved – including already ballooning inventories. Who the heck is going to buy all this crude out of storage when production is soaring faster than demand?

But their thinking has gotten a lot of press recently which makes me think that they’re trying to lure others into that trade for reasons of their own.

But there is a bitter irony: The plunge in the price of oil is pushing desperate drillers, buckling under their debt, to maximize production from existing wells while slashing operating costs and capital expenditures. BHP Billiton, perhaps unwittingly, explains this irony: despite the oil glut, collapsed prices, layoffs, and shuttered facilities, US oil production is soaring and will continue to soar, at least for a while.