
by Wolf Richter •
Soaring US crude oil inventories.
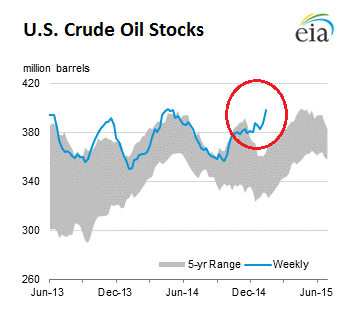
Crude oil inventories in the US (excluding the Strategic Petroleum Reserve) rose by 10.1 million barrels to 397.9 million barrels during the week ended January 16, the EIA reported on Thursday. Inventories have now reached 397.9 million barrels, the highest level for this time of year in “at least the last 80 years,” or as far as the EIA’s records go back.
This chart by the EIA shows that current inventory levels (blue line) have been on a terrific upward trajectory that defies the 5-year range and seasonal movements.
These ballooning crude oil stocks will exert further downward pressure on prices.
What I’m scratching my head about is what these speculators are thinking when they’re leasing tankers to fill them up with “cheap” crude, waiting for the price to rise. Leasing a tanker is not free, unlike borrowing money overnight. And there are plenty of other costs and risks involved – including already ballooning inventories. Who the heck is going to buy all this crude out of storage when production is soaring faster than demand?
But their thinking has gotten a lot of press recently which makes me think that they’re trying to lure others into that trade for reasons of their own.
But there is a bitter irony: The plunge in the price of oil is pushing desperate drillers, buckling under their debt, to maximize production from existing wells while slashing operating costs and capital expenditures. BHP Billiton, perhaps unwittingly, explains this irony: despite the oil glut, collapsed prices, layoffs, and shuttered facilities, US oil production is soaring and will continue to soar, at least for a while.
Read the original article at http://wolfstreet.com/2015/01/22/this-chart-shows-why-the-oil-bust-will-last/
No comments:
Post a Comment