Showing posts with label Red Flags. Show all posts

Thursday, March 24, 2016

Three Reasons to Be Bearish Right Now


The stock market looks dangerous.


By Jeff Clark, Growth Stock Wire:


There are so many reasons to be bearish right now, I can’t count all of them. Dozens of indicators are flashing “warning” signs. The market looks dangerous. Almost everything is pointing toward an intermediate-term decline coming soon.

And if it plays out the way it did when we had the same setup in November, stocks may give up all of the gains they’ve enjoyed over the past few weeks. So you need to be cautious right now. Here are three reasons why…

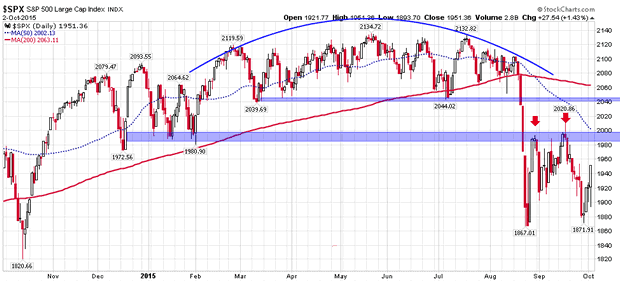
One, the S&P 500 is tracing out an identical pattern to what it did last October — just before the S&P 500 fell 5% in two weeks and 18% in three months. Take a look at the one-year chart of the S&P 500…


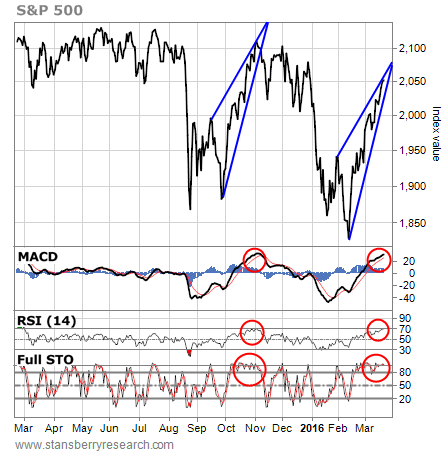
This entire bounce off the February lows has the exact same characteristics as the October rally. Both started from deeply oversold levels, following a sharp selloff in the stock market. They both formed dangerous “rising-wedge” patterns on the chart. And both pushed the daily momentum indicators – like the moving average convergence divergence (MACD), the relative strength index (RSI), and the full stochastics – into extreme overbought territory.
If the similarities continue, then then the stock market is likely headed for a rough period – starting soon.

The second big reason to be bearish is that the Volatility Index (“VIX”) options are pricing in a sharply higher VIX over the next month.


The Volatility Index is a measurement of fear in the marketplace. When the VIX is high and rising, investors are scared and traders are bearish. A low and declining VIX indicates strong bullish sentiment and complacency among traders. But it’s the VIX option prices that can tell traders where the VIX is headed, and by extension, where the stock market is headed. And right now, VIX options are sending traders a bearish signal.

VIX options are European-style contracts – meaning they can only be exercised on option-expiration day. This eliminates any possible “arbitrage” effect (the act of buying an option, exercising it immediately, and then selling the underlying security for a profit). So VIX options will often trade at a discount to intrinsic value.

For example, the VIX closed around 13.80 on Monday. At that level, the VIX April $15 calls are intrinsically worth $1.20. But they were being offered for only $0.50. That’s a $0.70 discount to intrinsic value.

If it existed as a regular American-style stock option, you could buy the call, exercise it, and liquidate the position all day long, picking up $70 for every contract you traded. The European-style feature prevents that from happening – because you can only exercise this contract on April’s option-expiration day.

VIX options provide terrific clues about where most traders expect the Volatility Index to be when the options expire. The current VIX option prices tell us that traders expect the index to be higher one month from now.

With the VIX at 13.80, the VIX April $14 calls – which are $0.20 out of the money – closed Monday at $3.20. The VIX April $14 puts – which have $0.20 of intrinsic value – closed at $0.20.

In other words, traders are willing to pay 16 times more to bet that the VIX will be higher by option-expiration day in April. And a higher VIX usually coincides with a falling stock market. We had a similar situation, by the way, in late October. Back then, VIX call options were trading for about six times the price of the equivalent put options.

Finally, multiple technical indicators have reached extreme overbought levels.


For example, the percentage of S&P 500 stocks trading above their 50-day moving average (“DMA”) lines has hit its highest level in about six years.

A reading of more than 80% is considered extremely overbought. This indicator closed Monday at 93.4%. (Since it is a percentage, it is almost mathematically impossible for it to go much higher.) Notice also that the current reading is higher than the level it reached in early November – just before stocks started to sell off.

The Summation Indexes for the New York Stock Exchange (NYSE) and the Nasdaq – which also measure overbought and oversold conditions – are back up in “nosebleed” territory.


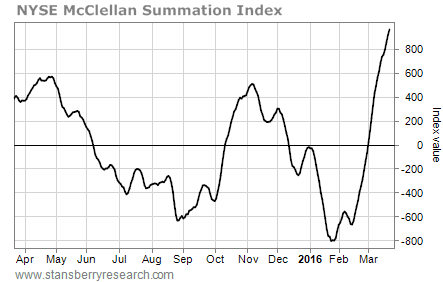
Both indexes closed Monday well above the overbought levels they reached last November. They’re even higher now than they were when the stock market peaked last May.

I could go on… I could show you how the McClellan Oscillators for both the NYSE and the Nasdaq recently hit overbought extremes. I could show you how the VIX is pressing down on its lower Bollinger Band – something that usually happens just before the stock market sells off. I could post a chart of the S&P 500’s “bullish percent index,” which is overbought and trading above its high from last May. You get my point.

As I said above, the market looks dangerous right now. All signs are pointing to an intermediate-term decline coming soon. And if it plays out the same way it did when we had an identical setup in November, stocks may give up all of their gains from the past few weeks. This is not a good time to be aggressively buying stocks. In fact, it’s probably a good time to speculate on the short side. By Jeff Clark, Growth Stock Wire

Saturday, October 17, 2015

Financial Markets Calm Before the Storm?


BIG PICTURE - Global business activity is slowing down and the majority of the developing nations are experiencing severe economic problems. Over in the developed world, Japan is contracting again, Euro zone is barely growing and even America's leading economic indicators are suggesting trouble ahead. Elsewhere, the CRB Index is trading at a 13-year low and this implosion in the prices of commodities is suggesting that all is not well with the global economy.

The crux of the matter is that the world is severely over-indebted (debt to GDP ratio of 286%, Figure 1) and without fiscal measures, viable reforms and debt restructuring, we will probably remain stuck in this low growth environment for years. Unfortunately, you cannot solve a problem of too much debt by encouraging even more borrowing; yet policymakers are trying to fix this mess by lowering interest rates and injecting liquidity.


Figure 1: Global stock of debt outstanding (US$ trillion)


Source: McKinsey & Company

Make no mistake, the US housing boom and subsequent financial crisis of 2008 were caused by the Federal Reserve's easy monetary policies which were put in place after the TMT bust. By dropping rates to emergency levels and keeping them there for years, Mr. Greenspan spawned the US housing bubble which almost destroyed the world's banking system. So, by keeping its Fed Funds Rate at zero since late 2008, it is ironic that the Federal Reserve is (once again) walking down the same path!

It is notable that even though the Federal Reserve's monetary policy has been extremely accommodative since the global financial crisis; the recovery in the US has been sub-par when compared to the previous economic cycles (Figure 2).

This is due to the fact that despite the carrot of record-low borrowing costs dangling in front of them, American households have refused to take the bait. Instead, they have done the sensible thing and deleveraged their balance-sheets.

Figure 2: US nominal GDP (1948-2014)


Source: Hoisington

Today, the household debt to GDP ratio in the US is 80%, well below the 100% level reached in 2008. This meaningful decline demonstrates that the Federal Reserve's ultra-accommodative monetary policies have done very little in terms of boosting household borrowing and consumption.

Instead, by dropping short-term rates to zero and keeping them there for 7 years, this time around, the Federal Reserve has succeeded in spawning new bubbles in the corporate sector, which pose a serious threat to the economy. Presented below is a list of the obvious corporate bubbles:
US Corporate debt - US$5trillion (+ US$2 trillion since 2007)
High yield (junk) bonds and leveraged loans - US$2.2 trillion (+ US$1.2 trillion since 2007)
Biotechnology - 7-fold increase in NASDAQ Biotech Index; most companies have no earnings

In addition to the above excesses in the corporate world, the Federal Reserve's zero interest rate policy (ZIRP) has also blown the following domestic bubbles:
Student loans - US$1.2 trillion (+ US$0.7 trillion since 2007)
Auto loans - US$1 trillion (+ US$0.4 trillion since 2009)

Last but not least, the Federal Reserve's monetary policy has also inflated these international bubbles:
Commodities boom and subsequent bust
Commodities exporters' boom and bust (Australia, Brazil, Canada and Russia)
Singapore property
Stock markets of Indonesia, Philippines and Thailand
Hong Kong property - HK$1.044 trillion mortgage debt (+ 76% since 2009)

In terms of the Hong Kong property market, although most experts and talking heads on TV remain convinced there is nobubble, research from the Hong Kong Monetary Authority (HKMA) shows that housing has become extremely unaffordable. If you review Figure 3, you will note that the housing price-to-income ratio has now risen to a record high of 15.9 and it is even higher than the 1997 peak of 14.6. Meanwhile, the income-gearing ratio has increased further to 70.7%, well above the long-term average of 50%. According to the HKMA, if the mortgage interest rate returned to a more normal level, say an increase of 300-basis points, the income-gearing ratio would soar to 95%!

Figure 3: Indicators of Hong Kong housing affordability


Source: Hong Kong Monetary Authority

Today, many Wall Street firms, prominent hedge fund managers and academics are putting forward arguments as to why the Federal Reserve should not raise the Fed Funds Rate. In their eyes, the macro-economic conditions are too uncertain to even warrant a 25bps rate hike.

In our view, these folk are dead wrong because unlike Europe and Japan, the US economy does not need ZIRP. If our assessment is correct, the longer the Federal Reserve stays on hold, the bigger will be the eventual bust.

Turning to the stock market, it is our contention that the bull market on Wall Street ended in May and we are now in the early stages of primary downtrend. You will recall that the US stock market fell sharply in mid-August and since then, it has gyrated within a wide trading range. To the casual observer, these wild swings may not make much sense but closer inspection reveals that there is indeed a method to the stock market's madness.

If you review Figure 4, you will note that between late February and early August, the S&P500 Index carved out an enormous rounding top formation; which culminated in the plunge below the key support levels (shaded areas on the chart). Thereafter, in late August, the relief rally faded around the lower support (now resistance) level. The S&P500 Index then spent two weeks in a sideways grind and the next rally attempt also ended at the same overhead resistance. Following this failed rally attempt, the S&P500 Index re-tested its August low and over the past few trading sessions, it has put together another advance.

Figure 4: S&P500 Index (daily chart)


Source: www.stockcharts.com

At this stage, nobody knows when this bounce will end but if we are in a primary downtrend, the rally should fade around overhead resistance level (2000-2040). Under this scenario, the next leg down will probably take out the August-low and trigger a waterfall decline. Currently, we cannot guarantee how low the S&P500 Index might fall; but we see support in the 1,700-1,740 area. So, if our bear market hypothesis is correct, then the ongoing rally will end soon and give way to the next wave of selling.

Look. There are no certainties when dealing with the future, but our work leads us to believe that the bull market is now in the rear view mirror and the odds of new highs over the following months are slim to none. Our bearish prognosis stems from the following data points:

S&P500 Index is below the 50-day and 200-day moving averages which are pointing down
NYSE Advance/Decline Line peaked in April (prior to the stock market peak in May + July)
Our proprietary trend following filter is now flashing 'downtrend'
NYSE Bullish Percent Index has dropped to just 31%
The High yield (junk) bond ETF has taken out the August-low
Only 22% of the NYSE stocks are trading above the 200-day moving average
Biotechnology - The leading sector of the bull-market has topped out (Figure 5)
Russell 2000 Small Cap Index and Russell 2000 Growth Index have taken out the August low
Out of the 35 industries we monitor, just 6 are trading above the 200-day moving average
Leading stocks are declining on good 'news', indicating the best has been discounted
Stocks are declining despite ongoing QE in Europe and Japan
Stocks are declining despite no rate hike and a 'dovish' Federal Reserve
Volume is rising on down days and falling on up days

Bearing in mind the above price and volume data, we are almost certain that the primary trend for equities is now down and global stock markets remain vulnerable to heavy declines.

Figure 5: NASDAQ - Biotechnology Index


Source: www.stockcharts.com

Given the weak technical picture and worsening economic backdrop, we currently have no exposure to risky assets (commodities, high yield debt and stocks). Instead, we have invested our managed capital in the following manner:
Long dated US Treasuries & Zero Coupon Bonds - 40% allocation
Short-term US Treasuries - 35% allocation
Short positions (biotechnology, industrials and technology) - 15% allocation
'Long' US Dollar position - 5% allocation
US Dollar cash - 5% allocation

If our analysis of the situation is even vaguely correct, our managed portfolios will do well in the looming deflation and our strategy should outperform our benchmark (MSCI AC World Index) by a wide margin. Conversely, if stocks continue to rally (unlikely scenario) and our primary trend filter flips to 'uptrend', we will promptly re-position our managed accounts.


Puru Saxena is the CEO of Puru Saxena Wealth Management, his Hong Kong based SFC regulated firm which offers discretionary portfolio management and research services to individual and corporate clients. The firm manages two trend-following strategies – Discretionary Equity Portfolio and Discretionary Fund portfolio. In addition, the firm also manages a Discretionary Blue-chip Portfolio which invests in high-dividend world leading companies. Performance data of these strategies is available from www.purusaxena.com

Puru Saxena also publishes Money Matters, a monthly economic report, which identifies trends and highlights investment opportunities in all major markets. In addition to the monthly report, subscribers of Money Matters also receive “Weekly Updates” covering the recent market action. Money Matters is available by subscription from www.purusaxena.com

Puru Saxena
Website – www.purusaxena.com

Puru Saxena is the founder of Puru Saxena Wealth Management, his Hong Kong based firm which manages investment portfolios for individuals and corporate clients. He is a highly showcased investment manager and a regular guest on CNN, BBC World, CNBC, Bloomberg, NDTV and various radio programs.

Copyright © 2005-2015 Puru Saxena Limited. All rights reserved.

Friday, July 31, 2015

11 Red Flags Events That Just Happened As We Enter The Pivotal Month Of August 2015


Are you ready for what is coming in August?  All over America, economic, political and social tensions are building, and the next 30 days could turn out to be pivotal.  In July, we saw things start to turn.  As you will read about below, a major six year trendline for the S&P 500 was finally broken this month, Chinese stocks crashed, commodities crashed, and debt problems started erupting all over the planet.  I fully expect that this next month (August) will be a month of transition as we enter an extremely chaotic time in the fall and winter.  Things are unfolding in textbook fashion for another major global financial crisis in the months ahead, and yet most people refuse to see what is happening.  In their blind optimism, they want to believe that things will somehow be different this time.  Well, the coming months will definitely reveal who was right and who was wrong.  The following are 11 red flag events that just happened as we enter the pivotal month of August 2015…
#1 Puerto Rico is going to default on a 58 million dollar debt payment that is due on Saturday.  Even though this has serious implications for the U.S. financial system, Barack Obama has said that there will be no bailout for “America’s Greece”.
#2 As James Bailey has pointed out, the most important trendline for the S&P 500 has finally been broken after holding up for six years.  This is a critical technical signal that will likely motivate a significant number of investors to sell off their holdings in the weeks ahead.
#3 The IMF is indicating that it will not take part in the new Greek debt deal.  As a result, the whole thing may completely fall apart
Leaked minutes of the fund’s latest board meeting, which took place on Wednesday, showed staff “cannot reach agreement at this stage” on whether to take part in the new €86bn (£60bn) bailout for Greece. The document said there were doubts over the capacity of the Athens Government to implement economic reforms, as well as the over the sustainability of the country’s sovereign debt pile, which is now projected to hit 200 percent of GDP.
The German Chancellor, Angela Merkel, only sanctioned a new Greek deal earlier this month on the condition that the IMF takes part.
#4 Italy is going down the exact same path as Greece, but Italy is going to be a much larger problem for Europe because it has a far, far larger economy.  This week, we learned that youth unemployment in Italy has reached a 38-year high of 44 percent, and Italy’s debt to GDP ratio has now hit 135 percent.
#5 The Canadian economy has officially entered a new recession.  This is something that was not supposed to happen.
#6 The price of oil plummeted close to 20 percentduring the month of July.  It was the worst month for the price of oil that we have seen since October 2008, which just happened to be during the height of the last financial crisis.
#7 Commodities just had their worst month in almost four years.  As I have written about previously, we witnessed a collapse in commodity prices just before the stock market crash of 2008 too.
#8 Thanks to Barack Obama, the U.S. coal industry is imploding, and some of the largest coal producers in the entire country have just announced that they aredeclaring bankruptcy
On Thursday, Bloomberg reported that the biggest American producer of coking coal, Alpha Natural Resources, could file for bankruptcy as soon as Monday.
Competitor Walter Energy filed for bankruptcy earlier this month, and several others have done the same this year.
#9 For the month of July, the Shanghai Composite Index was down 13.4 percent.  Despite unprecedented government intervention to prop up the market, it was the worst month for Chinese stocks since October 2009.
#10 A major red flag that a recession in the United States is fast approaching is the fact that Exxon Mobile just announced their worst earnings for a single quartersince 2009.  Compared to the same time period one year ago, Exxon Mobile’s earnings were down 51 percent.
#11 Chevron is another oil giant that has seen earnings plunge.  In the second quarter of this year, Chevron’s earnings were down an eye-popping 90 percent from a year ago.
And in this list I didn’t even mention the economic chaos that is happening down in South America.  For full coverage of that, please see my previous article entitled “The South American Financial Crisis Of 2015“.
To a certain extent, I can understand why most Americans are not alarmed about the months ahead.  The relative stability of the past several years has lulled most of us into a false sense of security, and the mainstream media is assuring everyone that everything is going to be just fine and that brighter days are ahead.  At this point, many believe that it is patently absurd to suggest that we could see an economic collapse in 2015.  But of course even though the signs were glaringly apparent, very few of us anticipated the financial crisis of 2008 either.
A few weeks ago, I authored a piece entitled “The Last Days Of ‘Normal Life’ In America“, and I stand by every single word of that article.  I truly believe that the era of debt-fueled prosperity that we have been enjoying for so long is coming to an end, and our standard of living will never again get back to this level.
Just yesterday, I had the chance to go over and stock up on some emergency supplies at a dollar store.  It always astounds me what you can still buy for a dollar.  The combined cost of raw materials, manufacturing, packaging, shipping and retailing most of these items shouldn’t be less than a dollar, but thanks to having the reserve currency of the world we are still able to go to these big box stores and fill up our carts with lots and lots of extremely inexpensive merchandise.
Unfortunately, this massively inflated standard of living is going to come crashing to a halt.  This next financial crisis is going to destroy the system that is currently producing such comfortable lifestyles for the vast majority of us, and that will be an extremely painful experience.
So enjoy this summer for as long as it lasts.  Even though August threatens to be pivotal, it is going to be nothing compared to what will follow.
Fall and winter are coming.
Prepare while there is still time to do so.