I have noticed that there are times when the KLSE drops so badly that even if you are a value investor, it makes sense to sell everything and wait till the stock market recovers.
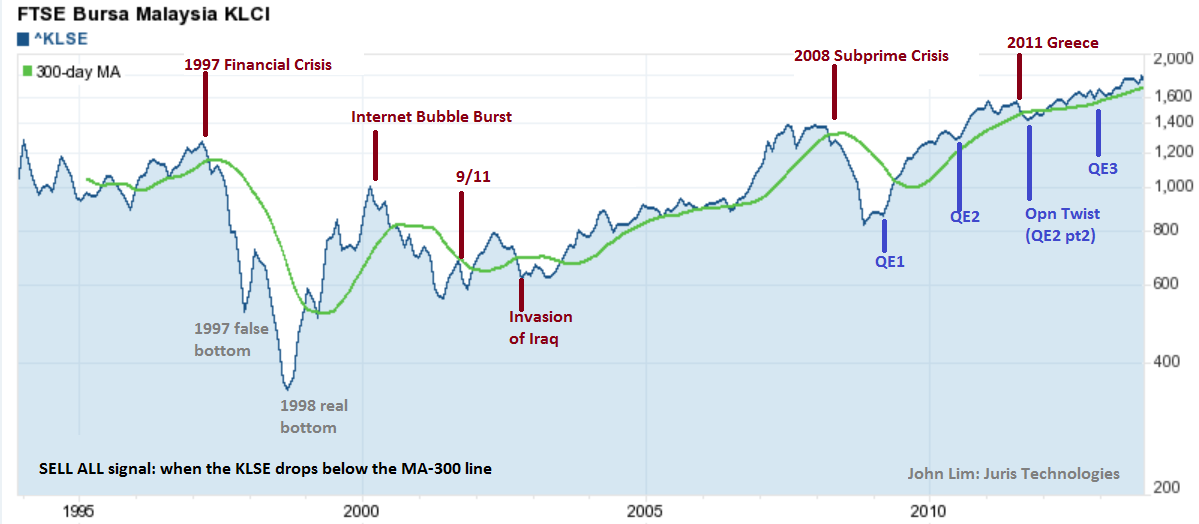
The problem is how to detect when the drop is a major fall, or just a twinge in the market. This chart suggests that detecting this is possible:
I have observed that when the KLSE drops below the 300-day moving average, this is a SELL ALL signal. For example, if you had bought shares at the peak in 1997 and you held on to them, you can see that the KLSE only recovered to 1997 levels in 2007. It would have been better to sell those shares at a small loss in 1997, then start buying profitably when the KLSE goes above the 300 day moving average at the end of 1998.
You can see the same technique also works for the 2000 Internet Bubble fall, the 2003 Invasion of Iraq, the 2008 subprime crisis, and 2011 Greece Euro crisis.
The only time this technique is iffy is after the 9-11 terrorist attack, when the KLSE was rising above the line, then suddenly plummeted when the planes struck New York. However if you had held on till 2002, you would probably have made a profit. 9-11 is a real black swan event, as there was no prior warning signs, unlike the other major falls.
You can also consider buying on the upswing before KLSE goes over the 300 day moving average. However you need to be really confident. As you can see in the 1997 fall there was a false bottom in late 1997, and the KLSE plunged even further, reaching the real bottom in August 1998.
I have also tested this with the S&P 500 and Hang Seng Index, and confirmed it works for all of these stock market indices.
Note: 300-day moving average can be plotted using Yahoo Finance chart.
Source of this article: http://juristech.net/juristech/detecting-major-drop-stock-market/


No comments:
Post a Comment