Friday, December 18, 2015

Uncle Z


I believed I came across Uncle Z in i3Investor forum many many months ago ....but when I went to his blog he did not update his blog for some time ...

So I thought he got tired and disappeared from blogging on stocks for good.

Today while reading an article I saw a link to Uncle Z blog and went to have a look ...hey he is back.

For those who do not know Uncle Z, I think he is a senior much much older than me, ha-ha.

He write about stocks and give some cun tips too ...much better than OngMali Blogspot ...ha ha ...here is the link to his blog >>> UncleZ on Value Investing

Happy reading and to Uncle Z ...welcome Back!

Saturday, December 12, 2015

Summary of Profit Tracking


As a follow-up in a previous article, I went ahead and did the following analysis on my top 5 profit stocks:

1. Frontkn 53.9%
2. Denko 12.4%
3. PPHB 11.7%
4. Xinhwa 6.6 %
5. Krono 4.3%

**(Open a spreadsheet or write in a personal trade diary)

1. Put in the stock code.

2. Write down where did I found the trade/stock.

3. Describe the profit.

4. What did I learn?

5. How can I improve?

-----------------------------------------------------------------------------------


FRONTKN


1. Frontkn (0128)

2. Saw an article in i3investor by (Icon8888) Frontken Corp - Semiconductor Division Doing Well dated 17/2/2015.


3. Saw the stock in a Rounding Bottom chart pattern. USD beneficiary due to subsidiaries in Taiwan, China and other SEA countries. First bot on 18/2 average around 0.188 cent. In April it started the breakout from the bottom. Bot and sold couple times and last sold at 0.31 cents.

4. I learnt to look out for Icon8888 articles and to look for Rounding Bottom chart patterns.

5. Should not have b
ot and sold a couple of times as I had to re-enter again at higher prices and high risk getting trapped!


DENKO


1. Denko (8176)

2. Saw an article in i3investor by
(Icon8888) Denko - Smallish Plastic Parts Manufacturer Expects Better Year Ahead on 16/7/2015.


3. Saw the stock in a Rounding Bottom chart pattern. FA - recently turnaround from losses. It is a USD beneficiary. I like small share base so I thought that chance of big move is higher. Took a big risk and bot on 23/7 at 0.37 cent & it rallied to 0.475 cents. Sold at 0.44 cents.

4. Seems like something I should have learnt already - read Icon8888 articles and to look for Rounding Bottom chart patterns.

5. Took a big risk - next time either get in early or forget the trade. (Icon8888 article the price at 0.30 cents and I bot at 0.37 cents.) Didn't know it that time but 0.475 cents was the highest point ever. 

PPHB


1. PPHB (8273)

2. Lucky pick when looking through the trading platform for a packaging stock. This stock has not moved much yet, still below RM1.00


3. Saw the stock in a Ascending Channel chart pattern. The stock is profit making all the years and is a USD beneficiary. First bot at 0.982 on 13/11 and last sold at 1.15 on 23/11 (bot and sold a couple of times). Was pure luck as the stock reported lower quarter earnings the next day and the following day gap down. So far never recovered to this price.

4. I learnt to look for Ascending Channel chart patterns. I guess correctly the rally was due to the impending quarter results.

5. Took a big risk as the Ascending Channel has been going on since the August big drop! Next time must find something earlier.


XINHWA


1. Xinhwa (5267)

2. New IPO listing on 30/6. I believe I was influenced after reading an article in i3investor by kiasutrader - Xin Hwa Holdings Berhad - The Efficient Land Transporter on 30/6/2015.


3. The stock is Main Board with a small share base (180mil). I like small share base as it can go far. It open strongly so I thought it will go far at least RM1.00. First bot at 0.87 on 1/7 (2nd day) and sold last at 0.99 on 13/7.(Later on the stock chart look like an Ascending Channel pattern ya.)

4. I learnt to look for new IPO listings. Some could go far like Xinhwa.

5. Bot early but sold too early too. Should have let it run until the stock say sell. It went up to a high of RM1.46


KRONO


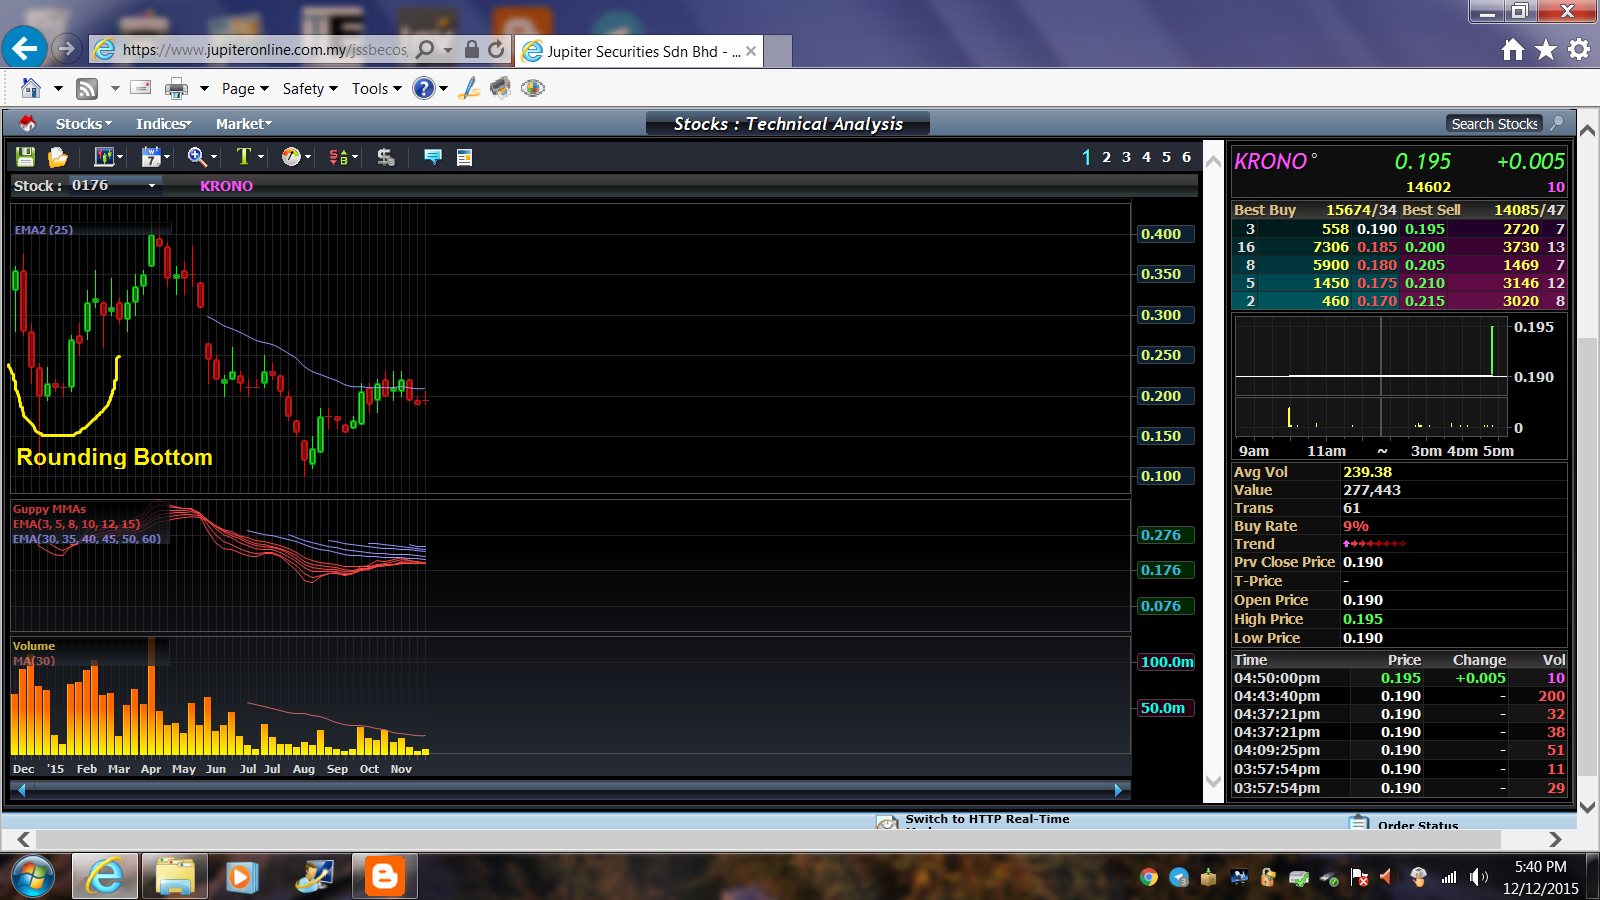
1. Krono (0176)

2. I believe a friend told me to buy this stock. Later I check and saw an article in Sun that Public Bank is one of their customer.


3. The stock has a Rounding Bottom chart pattern after the market sharp drop in Dec 2014 & Jan 2015. It was rebounding so I felt quite confident to buy. Bot at 0.245 cents and sold at 0.27 cents on 6/2. Contra trade.

4. I was quite confident to buy as the stock had dropped sharply and rebounding (Rounding Bottom). Low at that point was around 0.19-0.20 cents.

5. Sold too early. Should have let it run until the stock say sell. It went up to a high of 0.415 cents.

Conclusion


Hope you liked the analysis and will benefit from this. There were many other stocks I've made money on but because the profits were tiny I see not much benefits to analyse them. 

So to summarized as follow on my top 5 profit stocks >> 

1) Read Icon8888 articles (LOL!)

2) Look for Rounding Bottom stocks 

3) Look for Ascending Channel stocks 

4) Look for USD beneficiary and exporter stocks.

Thanks for reading and if you like more articles in the future, join me at Ong Mali on Facebook.

Sunday, December 6, 2015

Profit Tracking


Hi all, its' already December ... how time flies!

I doubt I will make a lot of trades till year end so why not take the time to recap all my trades for the year.

This article is all about Profit Tracking. The next article will be on Loss Tracking.

Profit Tracking

Profit tracking simply means analysing the profitable trades you have made over the year.

By analysing the trades, it could help us traders learn how to become more successful in the market place.

I will pick my top 5 Profit trades and see how it stack up to the overall total profit I've made -

1. Frontkn 53.9%
2. Denko 12.4%
3. PPHB 11.7%
4. Xinhwa 6.6 %
5. Lcth 2.1%  Krono 4.3% 

Total = 88.9% !

Wow ... only 5 stocks and they oredi contributing a whopping 88.9% of my total profit.

So, what's next? ...

You will need to further analyse all these 5 stocks and trades ... to determine how did the trades became a success ...and hoping you can repeat this trick over and over again.

The Mechanics Involved in Profit Tracking

1. Open up a spreadsheet.

2. Put in the stock code.

3. Write down where did I found the trade/stock.

4. Describe the profit.

5. What did I learn?

6. How can I improve?

If you are not lazy like me, you can write a trade journal to record all the trades and after each month ended, you do the profit tracking analysis.

In my analysis, I choose the top 5 stocks because I oredi know only a few stocks contributed to most of my profits. I also do not trade much every month, maybe that why the results could be distorted.

If you have a more evenly profit contribution, and trade a lot, you have more stocks and can choose top 10 or 15 stocks.

Remember the whole purpose of this analysis is to become a better and more efficient trader or investor in the stock market.

All the best!

GA

Saturday, November 14, 2015

Oil is going lower ...and lower ..


Seems like what this guy is saying that oil prices will go lower and remain low for at least till March-April 2016 (early spring).


Source : http://blog.smartmoneytrackerpremium.com/2015/11/charts-of-the-day-25.html

Monday, November 9, 2015

The US Dollar Bull Market Could Trigger a $9 Trillion Debt Implosion


The US Dollar rally, combined with the ECB’s policies and the Fed’s hint at raising rates in December, is at risk of blowing up a $9 trillion carry trade.

When the Fed cut interest rates to zero in 2008, it flooded the system with US Dollars. The US Dollar is the reserve currency of the world. NO matter what country you’re in (with few exceptions) you can borrow in US Dollars.

And if you can borrow in US Dollars at 0.25%... and put that money into anything yielding more… you could make a killing.

A hedge fund in Hong Kong could borrow $100 million, pay just $250,000 in interest and plow that money into Brazilian Reals which yielded 11%... locking in a $9.75 million return.

This was the strictly financial side of things. On the economics side, Governments both sovereign and local borrowed in US Dollars around the globe to fund various infrastructure and municipal projects.

Simply put, the US Government was practically giving money away and the world took notice, borrowing Dollars at a record pace. Today, the global carry trade (meaning money borrowed in US Dollars and invested in other assets) stands at over $9 TRILLION (larger than the economy of France and Brazil combined).

This worked while the US Dollar was holding steady. But in the summer of last year (2014), the US Dollar began to breakout of a multi-year wedge pattern:


Why does this matter?

Because the minute the US Dollar began to rally aggressively, the global US Dollar carry trade began to blow up. It is not coincidental that oil commodities, and emerging market stocks took a dive almost immediately after this process began.

The below chart shows an inverted US Dollar chart (so when the US Dollar rallies, the chart falls), Brazil’s stock market (blue line), Commodities in general (red line) and Oil (green line). As you can see, as soon as the US Dollar began to rally, it triggered an implosion in “risk on” assets.


This process is not over, not by a long shot. As anyone who invested during the Peso crisis or Asian crisis can tell you, when carry trades blow up, the volatility can be EXTREME.

Indeed, the US Dollar as broken out of a MASSIVE falling wedge pattern that predicts a multi-year bull market.


The market drop in August triggered by China devaluing the Yuan (another victim of the US Dollar bull market) was just the start. Once the US Dollar rally really begins picking up steam, we could very well see a crash.


Source: http://www.zerohedge.com/news/2015-11-09/us-dollar-bull-market-could-trigger-9-trillion-debt-implosion