Saturday, March 28, 2015

Understanding Stock chart Patterns (part 2)


As you are probably aware, professional investors use stock chart patterns to show them the direction where a stock is going in the foreseeable future. I have wrote some basic understanding on stock chart patterns earlier. If you have not read it, you can have a look over here.

Why Do Chart Patterns Fail?


If you have been applying your knowledge on chart patterns in the stock market, you will realize quickly that using these indicators to make money on stocks is no magic formula to riches. This is usually the case due to a phenomenon called a failed or false breakout.

A false upside breakout occurs when the share price rises above resistance and sucks in buyers before reversing and falling. According to GuerillaStockTrading.com website, false breakouts happen more often than not due to the actions of institutional funds selling off once the share price break the resistance point.

The website goes on to say that false breakouts provide institutional traders with most of their best trading opportunities which is why institutional traders most often are the ones who cause these patterns to form in charts.

It sounds like some low down dirty trick an institutional traders and large players use against you but hey this is all legal and above board. Remember this is just a game to them.

How To Win On Chart Patterns?


Since you now know why chart patterns often failed in your setups, the next question will surely be as to how to win on chart patterns, right? Here are some of the few tricks and tips I found useful in this area.

Go For Highest Probability Chart Patterns

Stock patterns are not created equal, period. Some patterns have higher chances of success than others. Some of the top successful patterns are the cup-and-handle, ascending triangles, bullish flag and bullish pennants. Use these high probabilities chart patterns for more success.

Always Be Disciplined

If the indicator is telling you to buy, you go ahead and buy. Whereas if the indicators say it is a sell, cut off without hesitation. And if you have miss the trade, forget it. Don’t worry about losing the trade because there will be plenty of other opportunities later. Be disciplined.

Only Have Small Positions

According to ThePatternSite.com who conducted 14,0000 chart patterns covering the years between 1991-2008, the failure rate of chart patterns have been increasing over time. They go on to say that their studies found the failure rate averages between 30-40% of the time. I can tell you that 30-40% failure rate is high. So, even though all the indicators are strong, you should NOT get overconfident and invest a large amount of your capital into each trade.

Analyse The Past Chart Patterns

They say the past trends could be an indication of what might happen in the future. The chart patterns found in a stock are no different. Many traders make the mistake of just analysing the present chart but neglecting the past. If you see the chart patterns failing often in the past, it could be an indication of what could happen in the stock later.

Need Lots of Spare Time

Stock pattern trading is time consuming. Seriously! Patterns traders would need to spend considerable time to wait for the trade to happen. Most of the top traders in this area have a lot of spare time to watch the market. If you do not have the time, don’t trade the patterns. Invest instead.

Conclusion


People who are serious about the stock market use stock chart patterns as an integral part to their everyday trading in the stock market. This is because stock patterns can indicate the future direction of the stock. However, there is some risk involved due to the failure rate brought about by the institutional traders. I hope you agree with me on this point. But if you use the techniques and apply them properly, they can bring you much success in the markets.

Friday, March 27, 2015

The Stock Indicator of the Future


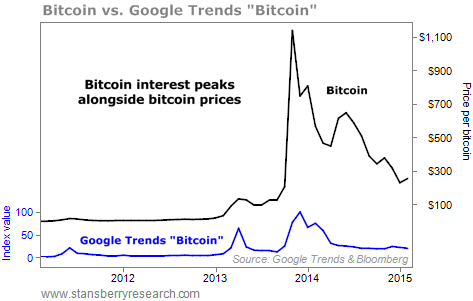
In early 2011, no one had heard of "bitcoin"... One bitcoin was worth less than a dollar.

But over the next three years, bitcoin exploded in popularity... and in price.

Soon, everyone was interested...

Online stores started accepting bitcoin as payment. Stories about bitcoin became popular news. And everyone began searching for bitcoin on the web.

By December 2013, web searches for bitcoin peaked, based on data from "Google Trends." More folks were interested than ever before (or since).

Guess what happened after web searches for bitcoin peaked...

I'll spare you the suspense. Bitcoin prices peaked that month. Take a look...


Here's what happened...

At bitcoin's peak in search popularity, everyone who was interested in bitcoin had already bought.

Bitcoin prices had only one place to go... down. The value of bitcoins fell around 75% in a little more than a year.

The message is simple: When greed peaks... when popularity peaks... you're usually near a peak in price.

For another example, take a look at Chinese stocks...

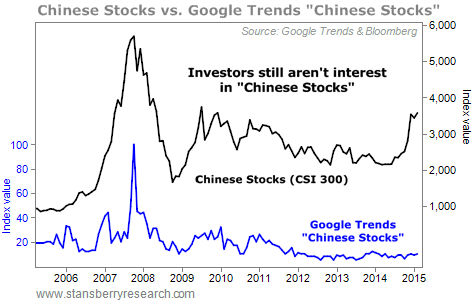
China had a bitcoin-like bull market in the mid-2000s. The entire market (the CSI 300 Index) soared 600% in a little more than two years. And of course, interest in Chinese stocks soared as a result.

Just like bitcoin, Google Trends search results for "Chinese stocks" by Americans show a massive peak the exact month that Chinese stocks peaked in 2007.

Chinese stocks crashed by 70% over the next year. Take a look...


Just a few years ago, we didn't have Google Trends data to learn from. But now, with our computer systems, we're studying this data for trading opportunities... The results are promising so far.

The simplest thing I can tell you is, when we are at a peak of greed (like bitcoin in 2013 and China in 2007) or a peak of fear (like the Global Financial Crisis of 2007-08), Google Trends search results often peak.

One important thing to note today is the lack of interest in Chinese stocks by U.S. investors (as you can see in the chart above).

I've pointed out this opportunity in DailyWealth a handful of times in the last few months... Chinese stocks have soared so far. But that doesn't mean the gains are over.

Are folks interested? Does everyone expect the gains to continue forever? That's when markets peak.

The answer in China is "absolutely not!" No one is searching for Chinese stocks today, as you can see from the chart.

The opportunity in Chinese stocks is fascinating... China is in a rip-roaring bull market. But still, no one is interested (as the Google Trends charts help show).

We still like China right now. The Google Trends data is one way for us to see that U.S. investors have not fallen in love with Chinese stocks yet.

We have just begun our work with Google Trends data. But we like what we see so far. This won't be the last time you see us mention it. Check out some search terms for yourself at Google.com/trends.

Good investing,

Steve.

Wednesday, March 25, 2015

The Stock Market Price Earnings Ratio


The stock market price earnings ratio is a guide to whether the overall stock market is expensive or cheap. It goes to say the stock market price earnings ratio could provide investors with an indicator whether it is a good time to buy stocks or to sell stocks in the stock market.

The stock market price earnings ratio is calculated by taking the total market value of all of the market’s stocks combined and dividing this number by their combined earnings. The calculation is tedious ... and now most online trading platforms have this ratio calculated for you ... just need to look under the Market Summary)

Based on the calculation on 26/3/2015, the current stock market price earnings ratio for Malaysia is 16.12. From past stock market records over the many years, we see the average (or mean) stock market price earnings ratio for Malaysia is around 16. So the stock market could be slightly overvalued at 16.12 although still not too high so as to be worried of a bubble stage.

What the Number Means ?


Here is the explanation behind the meaning of the stock market P/E Ratio for Malaysia :

Overvalued – P/E Ratio above 18

Fair valued – P/E Ratio between 14 to 18

Undervalued – P/E Ratio below 14


However, many people find the stock market price earnings ratio misleading. A case in point is the year 2010 (see the P/E Ratio chart above) where the P/E Ratio was around 18-19 while the KLCI Index is below 1,300 points. And today when the KLCI Index is at 1,800 points the P/E Ratio decreased to 16.12!

This situation could easily happen because during 2010, profits margins and earnings were very low due to the recession causing the P/E Ratio to be higher. A better indicator will be using the Shiller P/E Ratio or simply called the PE10 where the average earnings over 10 years are taken instead of 1 year and they are subsequently adjusted for inflation.

Still, despite some misgivings about the accuracy of stock market price earnings ratio, knowing the KLSE market PE, you can get a feel of the total valuation of the whole market.

Should the PE be high, you will probably not want to put in fresh money into the market and perhaps sell some of the stocks.

Should the PE be low, you will probably not want to cash out from the market together with the herd and perhaps actually put more money into stocks.

Conclusion


We can safely conclude that although the KLCI has gone up substantially breaking a fresh new high in the last 6 years, the market is NOT overvalued using the market PE as a guide. It is at at FAIR valuation, not undervalued but certainly not in the excessively overvalued region, i.e. a bubble situation.

Friday, March 20, 2015

Why the Strong Dollar Leads to Deflation, Recession and Crisis


The crisis that began seven years ago with easy lending and subprime mortgages, has entered its final phase, a currency war between the world’s leading economies each employing the same accommodative monetary policies that have intensified market volatility, increased deflationary pressures, and set the stage for another tumultuous crack-up. The rising dollar, which has soared to a twelve year high against the euro, has sent US stock indices plunging as investors expect leaner corporate earnings, tighter credit, and weaker exports in the year ahead. The stronger buck is also wreaking havoc on emerging markets that are on the hook for $5.7 trillion in dollar-backed liabilities. While most of this debt is held by the private sector in the form of corporate bonds, the stronger dollar means that debt servicing will increase, defaults will spike, and capital flight will accelerate. Author’s Michele Brand and Remy Herrera summed it up in a recent article on Counterpunch titled “Dollar Imperialism, 2015 edition”. Here’s an excerpt from the article:


“There is the risk for a sell-off in emerging market bonds, leading to conditions like in 1997. The multitrillion dollar carry trade may be on the verge of unwinding, meaning capital fleeing the periphery and rushing back to the US. Vast amounts of capital are already leaving some of these countries, and the secondary market for emerging bonds is beginning to dry up. A rise in US interest rates would only put oil on the fire.


The World Bank warned in January against a “disorderly unwinding of financial vulnerabilities.” According to the Financial Times on February 6, there is a “swelling torrent of ‘hot money’ cascad[ing] out of China.” Guan Tao, a senior Chinese official, said that $20 billion left China in December alone and that China’s financial condition “looks more and more like the Asian financial crisis” of the 1990s, and that we can “sense the atmosphere of the Asian financial crisis is getting closer and closer to us.” The anticipated rise of US interest rates this year, even by a quarter point as the Fed is hinting at, would exacerbate this trend and hit the BRICS and other developing countries with an even more violent blow, making their debt servicing even more expensive.” (Dollar Imperialism, 2015 Edition” Michele Brand and Remy Herrera, CounterPunch)


The soaring dollar has already put the dominoes in motion as capital flees the perimeter to return to risk-free assets in the US. At present, rates on the benchmark 10-year Treasury are still just slightly above 2 percent, but that will change when US investment banks and other institutional speculators– who loaded up on EU government debt before the ECB announced the launching of QE–move their money back into US government bonds. That flush of recycled cash will pound long-term yields into the ground like a tent-peg. At the same time, the Fed will continue to “jawbone” a rate increase to lure more capital to US stock markets and to inflict maximum damage on the emerging markets. The Fed’s foreign wealth-stripping strategy is the financial equivalent of a US military intervention, the only difference is that the buildings are left standing. Here’s an except from a Tuesday piece by CNBC:


“Emerging market currencies were hit hard on Tuesday, while the euro fell to a 12-year low versus the U.S. dollar, on rising expectations for a U.S. interest rate rise this year. The South African rand fell as much as 1.5 percent to a 13-year low at around 12.2700 per dollar, while the Turkish lira traded within sight of last Friday’s record low. The Brazilian real fell over one percent to its lowest level in over a decade. It was last trading at about 3.1547 to the dollar…


The volatility in currency markets comes almost two years after talk of unwinding U.S. monetary stimulus sent global markets reeling, with some emerging market currencies bearing the brunt of the sell-off…


Emerging market (EM) currencies are off across the board, as markets focus back on those stronger U.S. numbers from last week, prospects for early Fed tightening, and underlying problems in EM,” Timothy Ash, head of EM (ex-Africa) research at Standard Bank, wrote in a note.


“In this environment countries don’t need to give investors any excuse to sell – especially still higher rolling credits like Turkey.” (Currency turmoil as US rate-hike jitters bite, CNBC)


Once again, the Fed’s easy money policies have touched off a financial cyclone that has reversed capital flows and put foreign markets in a downward death spiral. (The crash in the EMs is likely to be the financial calamity of the year.) If Fed chairman Janet Yellen raises rates in June, as many expect, the big money will flee the EMs leaving behind a trail of bankrupt industries, soaring inflation and decimated economies. The blowback from the catastrophe is bound to push global GDP into negative territory which will intensify the currency war as nation’s aggressively compete for a larger share of dwindling demand.


The crisis in the emerging markets is entirely the doing of the Federal Reserve whose gigantic liquidity injections have paved the way for another global recession followed by widespread rejection of the US unit in the form of “de-dollarization.” Three stock market crashes and global financial meltdown in the length of decade and a half has already convinced leaders in Russia, China, India, Brazil, Venezuela, Iran and elsewhere, that financial stability cannot be achieved under the present regime. The unilateral and oftentimes nonsensical policies of the Fed have merely exacerbated inequities, disrupted normal business activity, and curtailed growth. The only way to reduce the frequency of destabilizing crises is to jettison the dollar altogether and create a parallel reserve currency pegged to a basket of yuans, dollars, yen, rubles, sterling, euros and gold. Otherwise, the excruciating boom and bust cycle will persist at five to ten year intervals. Here’s more on the chaotic situation in the Emerging Markets:


“The stronger the US boom, the worse it will be for those countries on the wrong side of the dollar. [...] The US Federal Reserve has pulled the trigger. Emerging markets must now brace for their ordeal by fire. They have collectively borrowed $5.7 trillion, a currency they cannot print and do not control. This hard-currency debt has tripled in a decade, split between $3.1 trillion in bank loans and $2.6 trillion in bonds. It is comparable in scale and ratio-terms to any of the biggest cross-border lending sprees of the past two centuries. Much of the debt was taken out at real interest rates of 1pc on the implicit assumption that the Fed would continue to flood the world with liquidity for years to come. The borrowers are ‘short dollars’, in trading parlance. They now face the margin call from Hell…. Stephen Jen, from SLJ Macro Partners said that ‘Emerging market currencies could melt down. There have been way too many cumulative capital flows into these markets in the past decade. Nothing they can do will stop potential outflows, as long as the US economy recovers. Will this trend lead to a 1997-1998-like crisis? I am starting to think that this is extremely probable for 2015.’” (Fed calls time on $5.7 trillion of emerging market dollar debt, Ambrose Evans Pritchard, Telegraph)


As the lone steward of the reserve currency, the Fed can boost global liquidity with a flip of the switch, thus, drowning foreign markets in cheap money that inevitably leads to recession, crises, and political unrest. The Fed was warned by Nobel Prize-winning economist, Joseph Stiglitz, that its loosy goosy-monetary policies, particularly QE, would have a ruinous effect on emerging markets. But Fed Chairman Ben Bernanke chose to shrug off Stiglitz’s advice and support a policy that has widened inequality to levels not seen since the Gilded Age while having no noticeable impact on employment , productivity or growth. For all practical purposes, QE has been a total flop.


On Thursday, stocks traded higher following a bleak retail sales report that showed unexpected weakness in consumer spending. The news pushed the dollar lower which triggered a 259 point rise on the Dow Jones. The “bad news is good news” reaction of investors confirms that today’s market is not driven by fundamentals or the health of the economy, but by the expectation of tighter or looser monetary policy. ZIRP (Zero interest rate policy) and the Yellen Put (the belief that the Fed will intervene if stocks dip too far.) have produced the longest sustained stock market rally in the post war era. Shockingly, the Fed has not raised rates in a full nine years due in large part to the atmosphere of crisis the Fed has perpetuated to justify the continuation of wealth-stripping policies which only benefit the Wall Street banks and the nation’s top earners, the notorious 1 percent.


The markets are bound to follow this convoluted pattern for the foreseeable future, dropping sharply on news of dollar strength and rebounding on dollar weakness. Bottom line: Seven years and $11 trillion in central bank bond purchases has increased financial instability to the point that any attempt to normalize rates threatens to vaporize emerging markets, send stocks crashing, and intensify deflationary pressures.


If that isn’t an argument for “ending the Fed”, then I don’t know what is.


By Mike Whitney.


Source : The article originated from http://www.marketoracle.co.uk/Article49858.html

Wednesday, March 18, 2015

Penny stocks to Maximize Profits


Very few types of investing can give as quick and high returns as penny stocks can. While they have a huge potential for making a lot of money very quickly, they are also very risky and require some expertise on the investor before they could be invested in. With the right information, you can know exactly which penny stocks to buy and which ones not to waste your time with!

Why Are Penny Stocks Risky?


The main reason why penny stocks are risky is because they have the tendency to drop a lot in a very short period of time. For example it does not take a lot to make a penny stock drop from $0.50 to $0.25. This would cut your investments into half! On the other hand, its’ not difficult for penny stocks to rise from $0.50 to $0.75 which gives you an amazing ROI in a short time of 50%.

How To Maximise Profits On Penny Stocks


To maximise profits on penny stocks, you will have to cut down the risk associated with them.

Many people who trade penny stocks invest without much thought and on gut feeling alone. They always play the offense game and do not know its’ actually a losers game. By offensive I mean taking actions like chasing after stocks, buying stocks already high and trading at expensive valuations. Using these strategies to trade speculative pennies stocks are almost a certainty that you will lose money in the stock market.

To minimise risk, you will need to have a good trading plan to trade pennies stocks. Be aware that trading these stocks could pose more challenging and require different trading strategies than a blue chip stock because of their speculative nature. Test your trading plan robustly by paper trading them before using real money to trade. Also, determine the stock chart pattern and establishing a proper entry point and exit point before you enter a trade is one way to lower the risk associated with penny stocks.

Lastly, doing research on the stock beforehand is another way to cut down the risk associated with pennies stocks. Because they are mostly the stocks of choice among unsophisticated investors, these group of investors will usually miss out on performing the necessary due diligence on these stocks. Commonly overlooking things like share price past trends, company profits, company’s latest developments, material litigations – all this can make a big difference in deciding if the company is worth investing or not.

Conclusion


Penny stocks was something that fired me up during my younger days. The thought of being able to find the next “big thing” when investing in it during its early stages can really entertain one’s imagination. Furthermore, many people are attracted by the chances of a large increase in profit in a matter of days or at times even hours than the thought of investing money in other type of shares for a longer period of time. The key to success in trading penny stocks lie in cutting down the risks to a minimum associated with investing in them. Happy trading!

Monday, March 16, 2015

Stock Investing Business Plan - Master These 12 Techniques To Enjoy Success !


Let’s not pussyfoot about it. Drawing up a good stock investing business plan on your own is a lot of work. HARD WORK.

Most people take the short-cut to hard work by relying on other people such as the brokers and their friends to avoid doing all the running around.

Unknowingly, if you get a broker or friends to put together your stock investing business plan for you, chances are you are probably heading to a recipe for disaster without knowing it.

When it comes to drawing up a good stock investing business plan, your strength comes from having the right knowledge on how to draw up a plan which caters to your needs. In the past, people involved in the stock market kept all the knowledge to themselves and they control every aspect of this lucrative business.

In the present day, things have turned around nicely and you now hold all the bargaining chips .. and making up a successful stock investing business plan should be very easy for you.

All you need to have are some basic knowledge about the stock market.

12 Questions/Techniques In Drawing Up A Stock Investing Business Plan.


1) Where To Start Investing ?

Most people start investing in the stock market of their country. If you are in Malaysia, you start by investing in Bursa Malaysia stock market. If you are in Singapore, begin with SGX stock market. Never start with foreign markets especially those that are thousands of miles away. Keep things simple and stupid (KISS).

2) How To Learn Investing?

Learn the investing techniques before you start investing. Read good materials, socialise with people who are more knowledgeable and attend seminars. Take your time and don’t be too impatient on this. You need time to build the foundation. Most people who lost took the wrong turn investing FIRST before learning investing. It is better to pay for learning rather than pay the tuition fees to the market. Learn as much as you can about the working of the stock market and the basic principals on what cause share prices to rise and drop.

3) What Stocks To Invest?

There are thousands of stocks in the stock market. Do you invest in growth stocks, dividend stocks or cyclical stocks?

Do you put money into telecom stocks, banking stocks or plantation stocks? Many choices. However, with a stock investing business plan in place, you decided early on what stocks you want to invest, thereby saving you time and money.

4) Do I Make Use of Stock Derivatives?

Stock derivatives are names given to financial instruments such as warrants and options. They are instruments added to the stock to make the stock more attractive to the investors. These are complex financial instruments that may (not) behave like the underlying stock. In the stock investing business plan, you should AVOID stock derivatives until you are more knowledgeable and experienced in the stock market.

5) Capital Employed?

Do you start with $5K, $10K or $25K? Is $10K enough? A stock investing business plan can provide quick solutions to this question. You could decide to start small say $10k then later when you get more experienced, you can easily top up the capital in the account. It is easier to manage an investment account with a small capital base. And in this way you will reduce your chance of over-trading when you are still a beginner.

6) Stock Strategies?

There are many ways to make money in the stock market. Which methods you will use? Are you going to make money via swing trading, day trading, momentum trading, scalping? Do you make use of fundamental analysis, technical analysis or both? Drawing up a stock investing business plan will assist you to alleviate some of these questions before you go “Live”.

7) Which Broker Platform To Use?

Since online trading is popular choice of investors now, you should have no problem looking for a broker platform that offer a low cost commission rate. Of course beside the commission costs, you also need to look carefully at all the tools and services the broker provides to their online customers.

8) What Account To Open?

There are 3 type of share investing accounts – cash, credit and margin accounts. Cash account allow you to purchase shares up to the limit of cash deposited into the account. It is a wise way to start investing for a beginner. Cash account commission is lower. Don’t start with credit or margin as you could end up over-trading and do not have enough funds to pay up when the purchase is due.

9) Investing Time Frame?

Are you looking to invest for the long-term, medium-term or short-term? Investing for the long-term require different investing techniques as well as different types of stocks from the medium or short-term investing.

10) Target Returns?

A good stock investing business plan will have a set of targeted returns. Targeted returns are the key performance indicator (KPI) on the stocks you own. Start with a conservative number such as 5% (benchmark against the average EPF rate) and increase the rate over time. Higher returns need to be balanced with higher risks involved. The indicator will tell you whether you are in good shape or have to close shop.

11) Diversification?

Diversification is a very broad subject which can itself be another article. It means how not to put all your eggs in a basket. It also means how much risk you are prepared to take in the market. In the early stage of a stock investing business plan, you will be confronted with the dilemma on how much cash to put to work into the stock market. Is it 60%, 80% or 100%? How much do you split between stocks, bonds and cash? Tough choices.

12) Age Factor?

Age factor is an important juggernaut in the stock investing business plan. Be realistic and plan according to your age factor. A young person age 30 can take more aggressive investing approach because he has employment income. But if you are a retiree without full-time work you cannot draw up an aggressive investing strategies into the plan because you could ill afford to lose your capital.

Conclusion


In order to be consistently successful you will need to take a completely different approach to your stock investing. One of the most important way to start on the right footing in the early stages of your investing journey is to draw up a stock investing business plan. Drawing up a stock investing business plan means that you are taking your investing seriously and treating stock investing like a business. I hope you agree with me on the stock investing business plan and the 12 questions/techniques I have put together to drawing up the plan. It will put you in the right footing to know about stock market investing and can lead to much success later.