Bookmark this blog/link and re-visit often for ideas/opinions/views on making $money$, from the Stock market, Forex, Commodities, Internet Business, etc.
Saturday, November 14, 2015
Oil is going lower ...and lower ..
Seems like what this guy is saying that oil prices will go lower and remain low for at least till March-April 2016 (early spring).
Source : http://blog.smartmoneytrackerpremium.com/2015/11/charts-of-the-day-25.html
Monday, November 9, 2015
The US Dollar Bull Market Could Trigger a $9 Trillion Debt Implosion
The US Dollar rally, combined with the ECB’s policies and the Fed’s hint at raising rates in December, is at risk of blowing up a $9 trillion carry trade.
When the Fed cut interest rates to zero in 2008, it flooded the system with US Dollars. The US Dollar is the reserve currency of the world. NO matter what country you’re in (with few exceptions) you can borrow in US Dollars.
And if you can borrow in US Dollars at 0.25%... and put that money into anything yielding more… you could make a killing.
A hedge fund in Hong Kong could borrow $100 million, pay just $250,000 in interest and plow that money into Brazilian Reals which yielded 11%... locking in a $9.75 million return.
This was the strictly financial side of things. On the economics side, Governments both sovereign and local borrowed in US Dollars around the globe to fund various infrastructure and municipal projects.
Simply put, the US Government was practically giving money away and the world took notice, borrowing Dollars at a record pace. Today, the global carry trade (meaning money borrowed in US Dollars and invested in other assets) stands at over $9 TRILLION (larger than the economy of France and Brazil combined).
This worked while the US Dollar was holding steady. But in the summer of last year (2014), the US Dollar began to breakout of a multi-year wedge pattern:
Why does this matter?
Because the minute the US Dollar began to rally aggressively, the global US Dollar carry trade began to blow up. It is not coincidental that oil commodities, and emerging market stocks took a dive almost immediately after this process began.
The below chart shows an inverted US Dollar chart (so when the US Dollar rallies, the chart falls), Brazil’s stock market (blue line), Commodities in general (red line) and Oil (green line). As you can see, as soon as the US Dollar began to rally, it triggered an implosion in “risk on” assets.
Indeed, the US Dollar as broken out of a MASSIVE falling wedge pattern that predicts a multi-year bull market.
Source: http://www.zerohedge.com/news/2015-11-09/us-dollar-bull-market-could-trigger-9-trillion-debt-implosion
Sunday, November 8, 2015
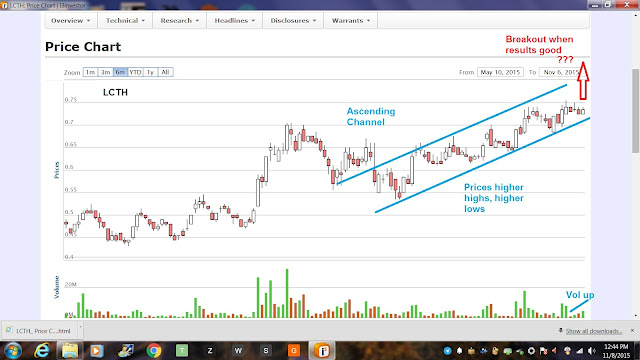
LCTH in Ascending Channel ...Pt 2
Teaser: Could this example be the chart of LCTH in the future ? We hope so.
Take note that LCTH is "expected" to announce their quarterly results this week, on Nov 13th, this Friday (AMC - after market close) - I based this date on the last 3 years 2012-2014 where quarter results were released on Nov 14th and in second week of November.
IF the results are good, I hope LCTH can breakout from this current channel (red arrow, see diagram above).
Disclaimer: I currently do not hold any LCTH stock but could initiate a position next week. This is my personal view and I could be wrong on the outcome. Trade at your own risk!
Saturday, November 7, 2015
ValueCap to pick firms from six key sectors
Read More : http://www.nst.com.my/news/2015/10/valuecap-pick-firms-six-key-sectors?utm_source=nst&utm_medium=nst&utm_campaign=nstrelated
Subscribe to:
Comments (Atom)


